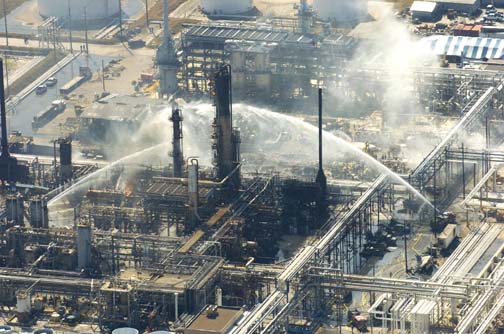
For my second project , I’ve decided to tackle the subject of safety and preventative maintenance. Using this Kaggle Dataset, I created and deployed a model which could potentially help oil refineries discover problems before they cost them money.
This data set is a record collection of accidents in the oil industry. Obviously, an accident happens because it’s an Accident(Duh)! No body expects accidents to occur, and when they do , they are a surprise. The definitive nature of what constitutes an accident makes it unpredictable, and in turn, very very costly.
What if there was a way to detect accident causes, and proactively fix them before the damage happens? That’s what I tried to do with my model. I’ll admit, the model which I deployed to My App is not the most robust example of ML, but it is a basic concept which works to provide users with information of where to look when it comes to potential disasters in their job site. That was my aim with this project. Not to build the perfect model, but to build something that works, and to let people interact and play with something that I built. Beyond the deployed model in the App, I have a much more refined model which I based everything off of. You can see my source code and work here.
Here’s an in depth breakdown of my process, and some visualizations which helped me along the way.
This was by definition a classification problem. My target is to predict the ‘Cause’ of an accident, which is a feature of the main dataframe. This category worked nicely with the Accuracy_Score evaluation metric. A breakdown of this feature shows that the majority class occurs 51% of the time, which established a realistic baseline for me to beat with my model. I analyzed and broke down this data set to exclude leakage by indentifying other features which may have been involved with the discovery of the cause of the accident(e.g. “Cause Subcategory.”) My model ultimately beats the baseline by 2 points when predicting on the test set. With a result like this, although my model works, it would be much more useful (and I would be much more satisfied) if I could get it to hit 10 points higher than baseline.
You’ll notice in the notebook that I tried 4 different models. Although all of the models that I built beat the baseline accuracy score, my first model was the best, with a Validation Accuracy of ~58%.
How do our features affect model performance?

Features that positively effect the model prediction are represented with a positive number, and features that negatively effect the model are represented with negative numbers. By doing Permutation Importance, I successfully removed all of the 0 importance features, and I learned more about what features are doing what to my model. From what I can see above, all of are features are contributing in some way to the model prediction, and they’re all doing so in a fair way. If there was a feature which was giving us leakage, it would have to have permutation importance of magnitudes different from the rest. To re-iterate, I’m looking to predict the Cause of an accident. Knowing that there was a spill, where it was, and how much it costed to repair is all fair game, because none of those features tell us why the accident occured in the first place.
After trying my first model out, I decided to ramp things up and go for another XGBClassifier with pumped up parameters.
How did our model perform with the data?

The above image shows the result. Regardless of how many estimators I used, this model plateau’d at a classification error of 0.457099, meaning that my accuracy with this model turned out to be ~53% rounded. Even though this model wasn’t as accurate as the first, I still think it was important to hypertune my parameters and explore the results.
My third model was a RandomForestClassifier, which still didn’t do as well as the original XGBClassifier. I tried a LogisticRegression model at the end as well, to the same result. Although all of these models beat baseline accuracy in the validation set, I wasn’t able to beat my very first model implemented, so I decided to use that one on my test set.
My final prediction on the test set gave me an accuracy score of 53%, meaning that I beat baseline by 2 points. This is better than not beating baseline, but I’d be happier to see a score higher than that! Here are some final takeaways for this project.
Where do most of the accidents occur?
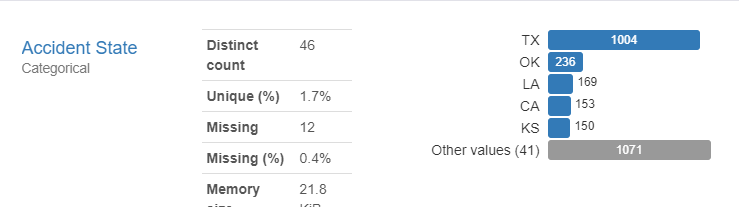
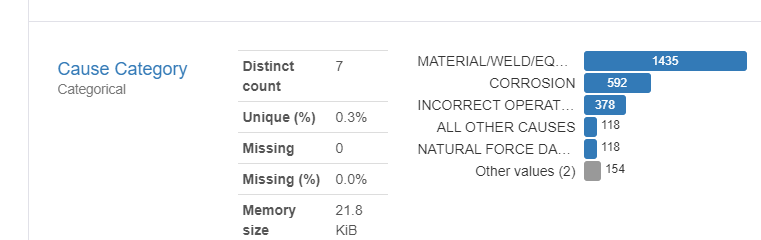
As we can see from the images above, some of the most obvious things we can learn from are right in front of our faces. Most Oil accidents take place in Texas(because Texas has the most Oil Refineries.) by looking at the rate at which each Cause Class is responsible for an accident, we know that the biggest area of focus is Material and Equipment failure, as well as poor welding jobs.
Preventative maintenance is about keeping things in top condition. This is done by thorough repetitive inspections, and quality control on multiple levels. Proper job safety training as well as machine operation training is not a one-time thing either, and it’s important to provide our workers on all levels with repeated exposure to material on preventative maintenance and best practices. The balancing act for companies boils down to this subject. How much are companies willing to spend on these preventative activities? It would have to be more cost effective than the cost of responding to an accident. Outside the realm of money, the bigger picture here is the world and the lives of the workers themselves. Obviously, big businesses aren’t interested in spending a lot of money to stop something that they don’t even know would happen. This is where the power of a machine comes in. If a ML algorithm could be developed to have extremely high precision in where a company should focus their efforts , the cost to preventative maintenance could drastically drop, as well as the rate of accidents. If we care about our planet, our fellow humans , and our safety, it’s in the best interest of businesses to find a better solution to discovering their weaknesses, whether it be through ML or traditional training.