 Whew, I haven’t posted in a long time! I’ve been very busy with my full time role, but recently, I have been making time to further develop some of my side projects. I hope that this article serves newcomers to data science as well as advanced practitioners in one way or another. With this post, I’ll aim to cover a number of different topic pertaining this interesting competition. I’ll break down the numer.ai tournament in many different ways. I’ll explain some of the challenges behind what makes it such a hard problem to do well with, and most importantly I’ll introduce a key workflow for automating the process of making submissions for the competition. I really hope that this helps some folks get started in data science and predictive modeling, whether they end up using IBM Cloud to automate or not is a matter of preference. So let’s get into the problem!
Project Overview
Numerai is an ongoing weekly competition which is open to anyone who is willing to try it. Essentially, this tournament is designed to help in the management of a real-life hedge fund. The hedge fund behind numerai aims to be “The last hedge fund in the world”, and it is aiming to achieve this by completely out-sourcing its quantitative analysis to a community of data science practitioners. In a traditional hedge fund, quantitative analysts use sensitive financial data to create signals and indicators for the movement of stock prices. It’s reasonable to assume that this project can be held in comparison with other financialy analysis projects such as this kaggle competition, but in reality, the actual participation of this project doesn’t require much financial background at all! This is because, with numerai, we are tasked with the incredible task of achieving the same outcome as a financial analyst… with completely masked data.
Problem Statement
Can you predict the performance of an anonymous stock ID, based on completely anonymized features?
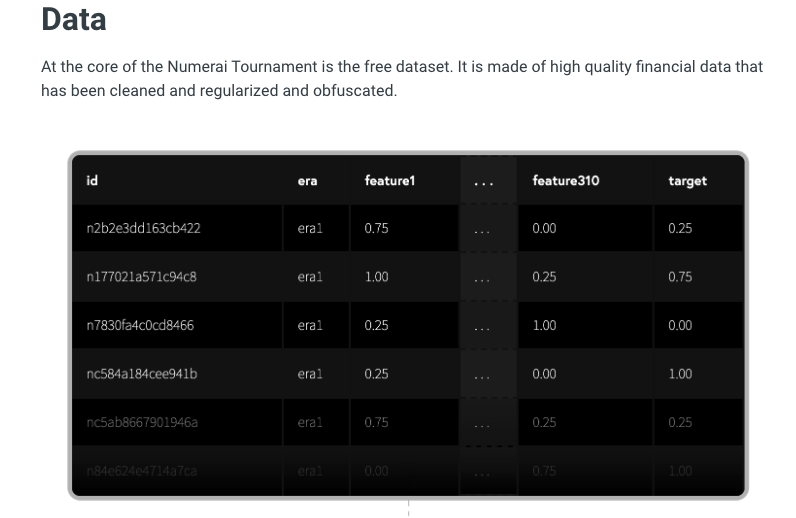
The data is completely obfuscated which means that we have no way of deciphering what the underlying asset is, nor what the features are truly representing. The competition is designed like this on purpose; because we are working to predict real values in the market, we need real data. The only way to get real financial data is through some expensive arrangements, but the founders have established a safe method for providing this same information without exposing sensitive information. So with masked data to work with, we are really reduced to machine learning and data science practices to help us not only create results, but improve upon them and refine them. I can’t stress enough how awesome the numer.ai community is in helping each other learn and grow. As you get started with the competition, make sure you create an account and introduce yourself to the community of practitioners through their forum.

From the main page of numer.ai you can download an excellent starting folder which will provide you with all of the assets you will need to give a first pass. Follow the directions from their documentation and you will have a submission for the most recent week ready in no time! The process of creating predictions and submitting them to numerai can be a cumbersome process to manually do on a weekly basis, so luckily, numer.ai has provided a walkthrough as to how to automate this process with AWS and CLI tools. Now, this is a great solution for automation and I want to really thank the community for providing this guidance. On my end, I wanted to achieve this same automation, but being that I’m well versed in the world of IBM software and technology, I had to take a step back and see what I could do to achieve this same level of automation with a different software platform. I’ve succeeded in just that; the numer.ai competition is now fully automated through IBM Cloud!
Evaluation Metrics
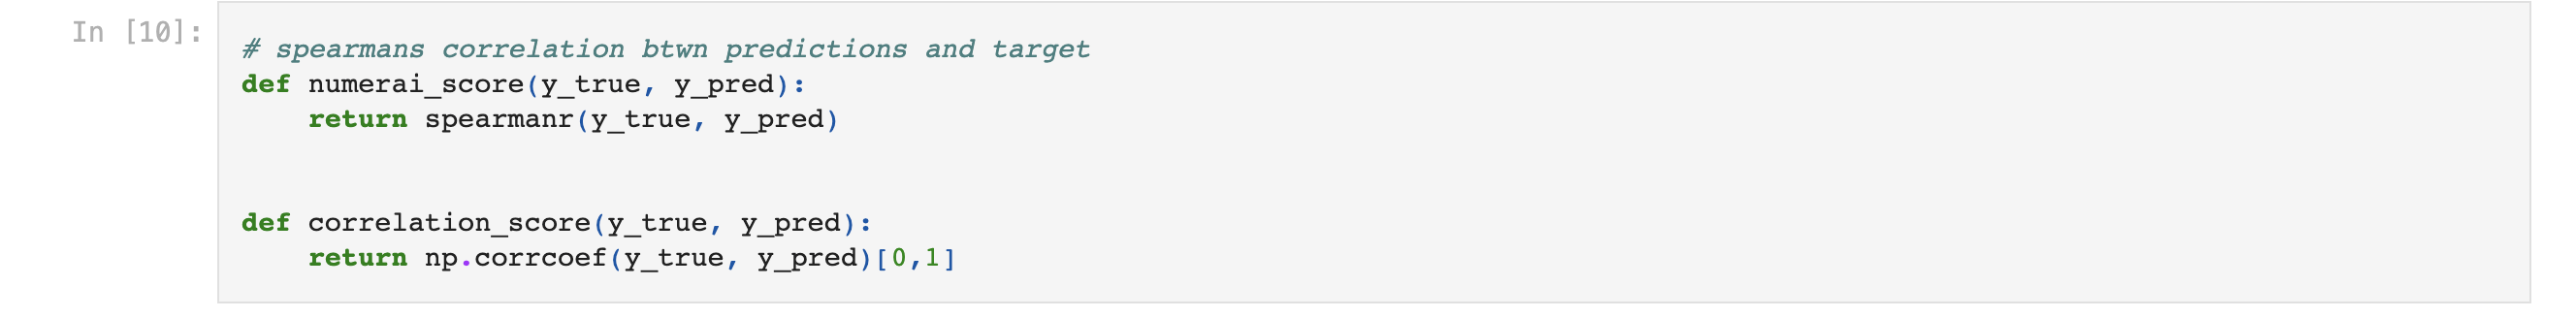
This competition is scored based on a variety of evaluation metrics which are explained in detail here here and here. All of these methods have unique qualities to them, but a universally agreed upon method for gauging model performance is the spearman’s correlation coefficient and regular coefficient of correlation. I score my models with these metrics as well as including the r2 score which serves to show which models are working to predict actual values rather than just random information.
Analysis
EDA and Visualizations
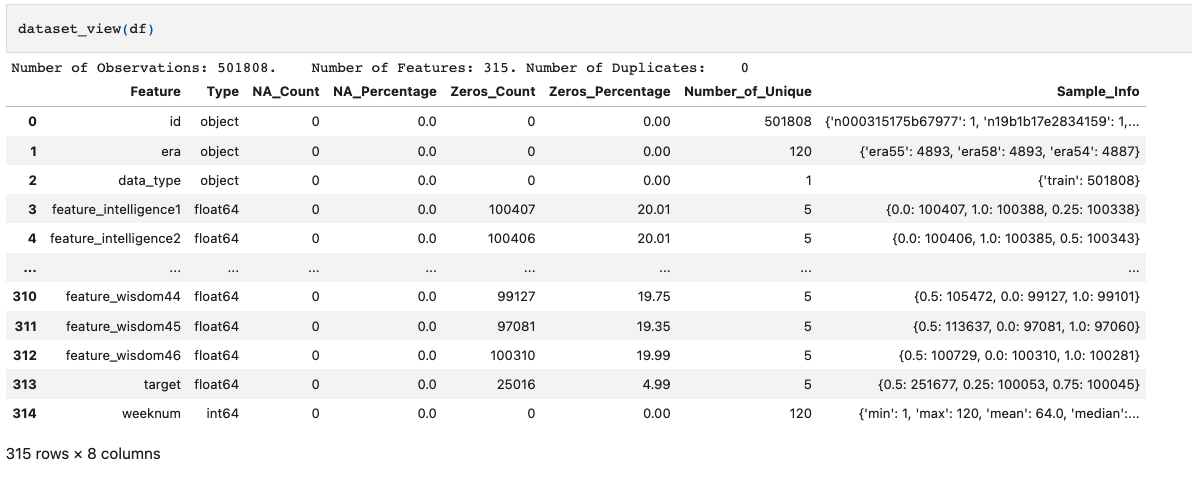
Here’s the quick and fast: The data is obfuscated(masked), and also fully cleaned, normalized, centered. This means that the data is ready to be worked on with machine learning models right away. For due diligence and proof of this, I’ll share some visuals and outcomes of some of my analysis. As always, you can read through the notebook to see more details.
- The data has a uniform distribution of values for features, and a normal distribution of values for the target. There are no null values.
- The
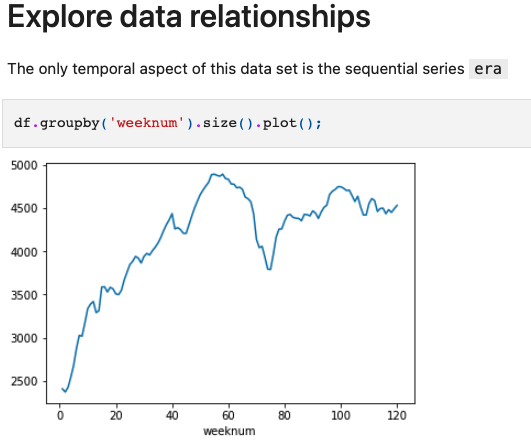
erafeature gives us a temporal quality to monitor, but it’s still a highly complicated concept to further engineer in new and helpful ways. Here is a chart which shows the varying size of eras
- Our
targetfeature is normally distributed
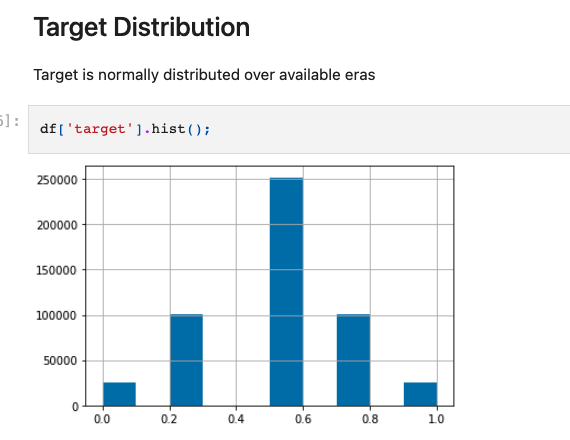
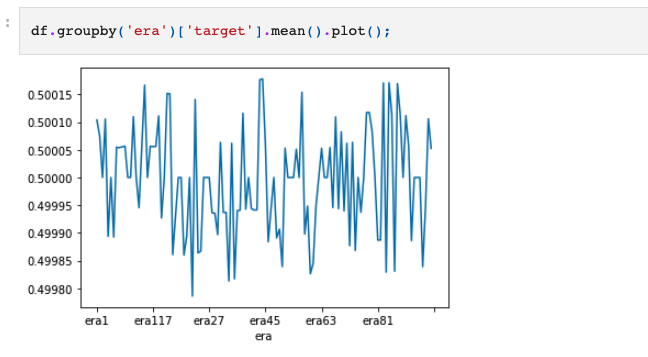
- also, the
targetis centered around it’s mean (notice the range of values on the y-axis)
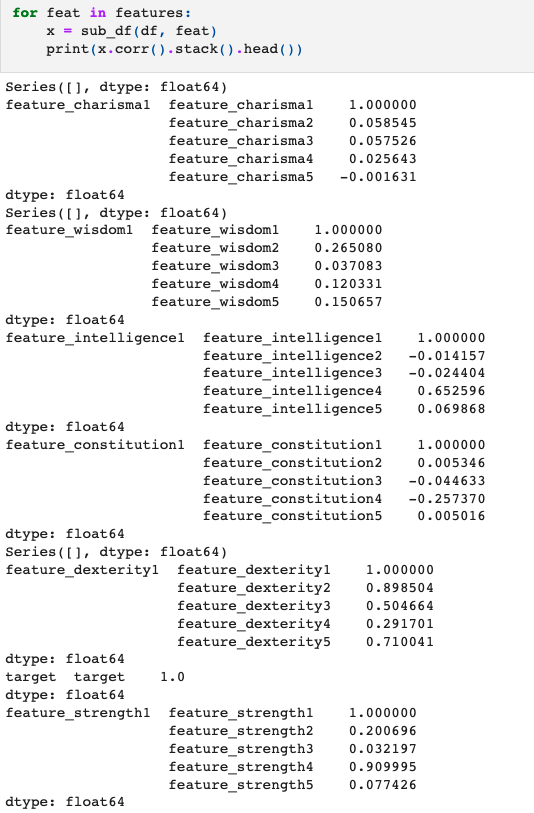
- intra-feature correlations show us that features with similar prefixes have varying levels of correlation
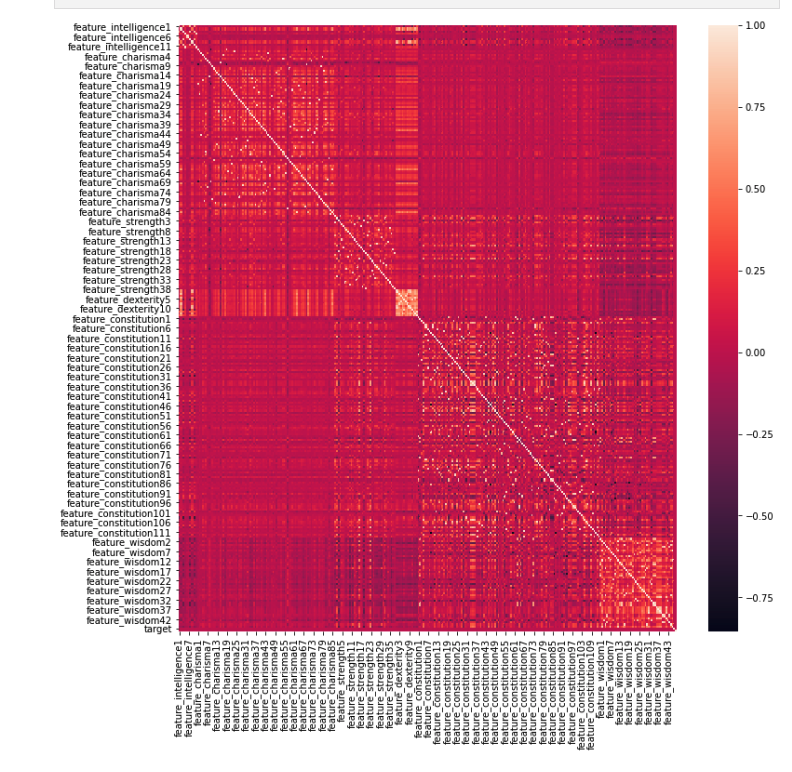
- A high level heatmap shows us that the data set is overall not correlated in any specific direction.
Methodology
Data Preprocessing
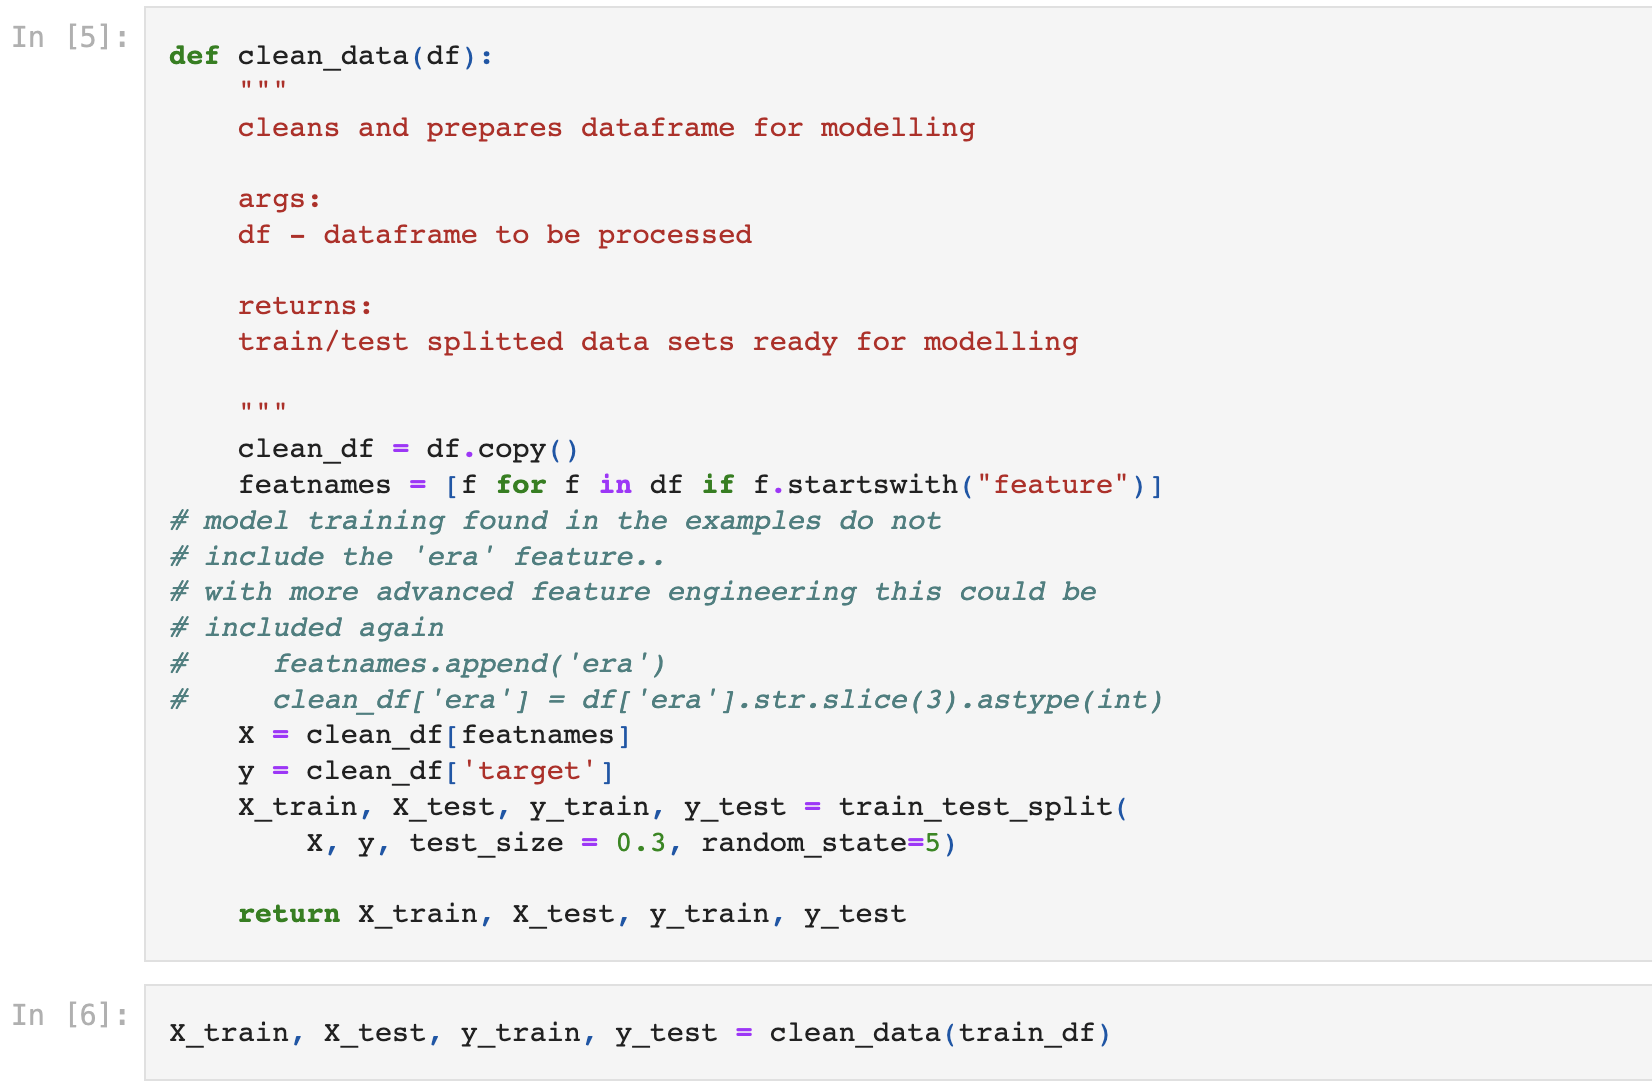
Since this data has already been cleaned, we don’t have to any vital data pre-processing. The process of cleaning and obfuscating the data is covered in detail here. For the sake of our competition submissions, I created a small data cleaning function which takes in the training data and returns a train / test split which is ready for training and testing with models.
Model Building and Implementation
For model development, we cover the entire process from pre-processing, to model implementation, metrics, and refinement. I recommend reading through the actual notebook where I write about the technical results of each process. It holds many more insights which I do not share in this readme. If you’re on a time crunch then just read through this and you should still get the summary of the work that has been done 😄
Model Implementation
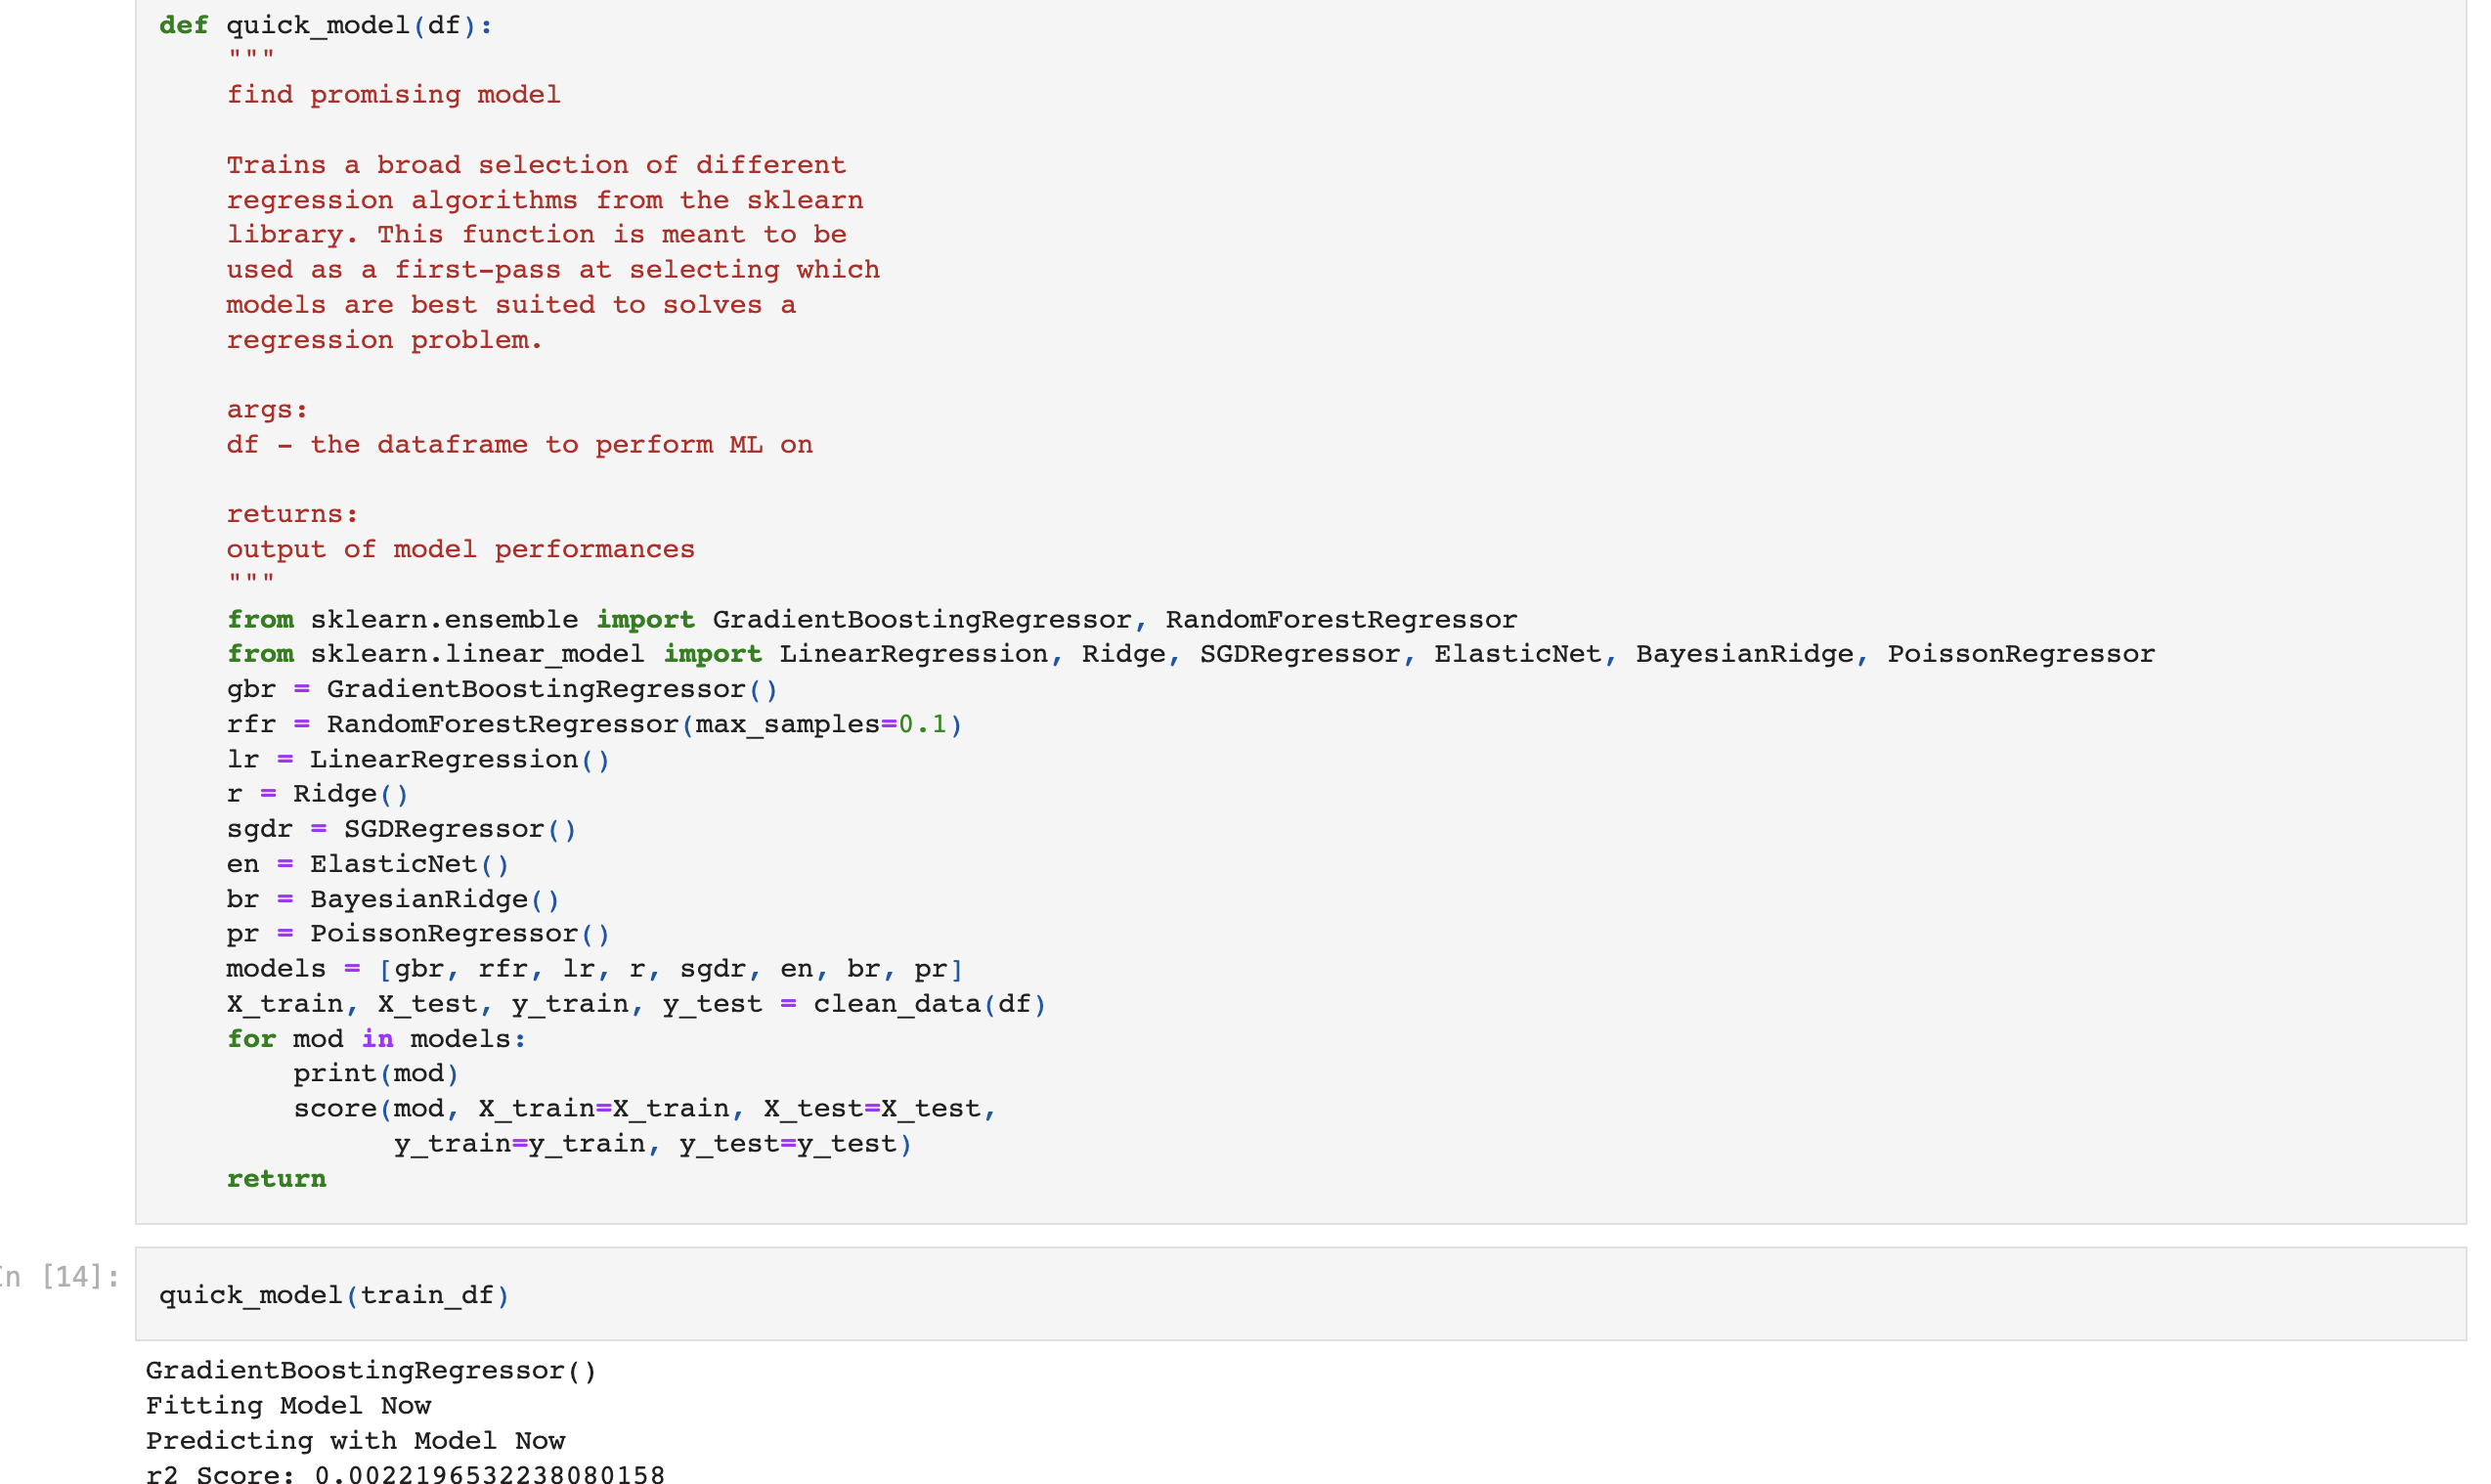
To prove the concept of automation with ibm cloud, I initially fitted and predicted with a simple linear regression model. I follow this by creating a function which tests a larger number of pre-built algorithms to observe the general performance of all of these different models. By observing the performance of these models, I can make more specific choices as to what I want to incorporate and what I can exclude from my research.
Refinement
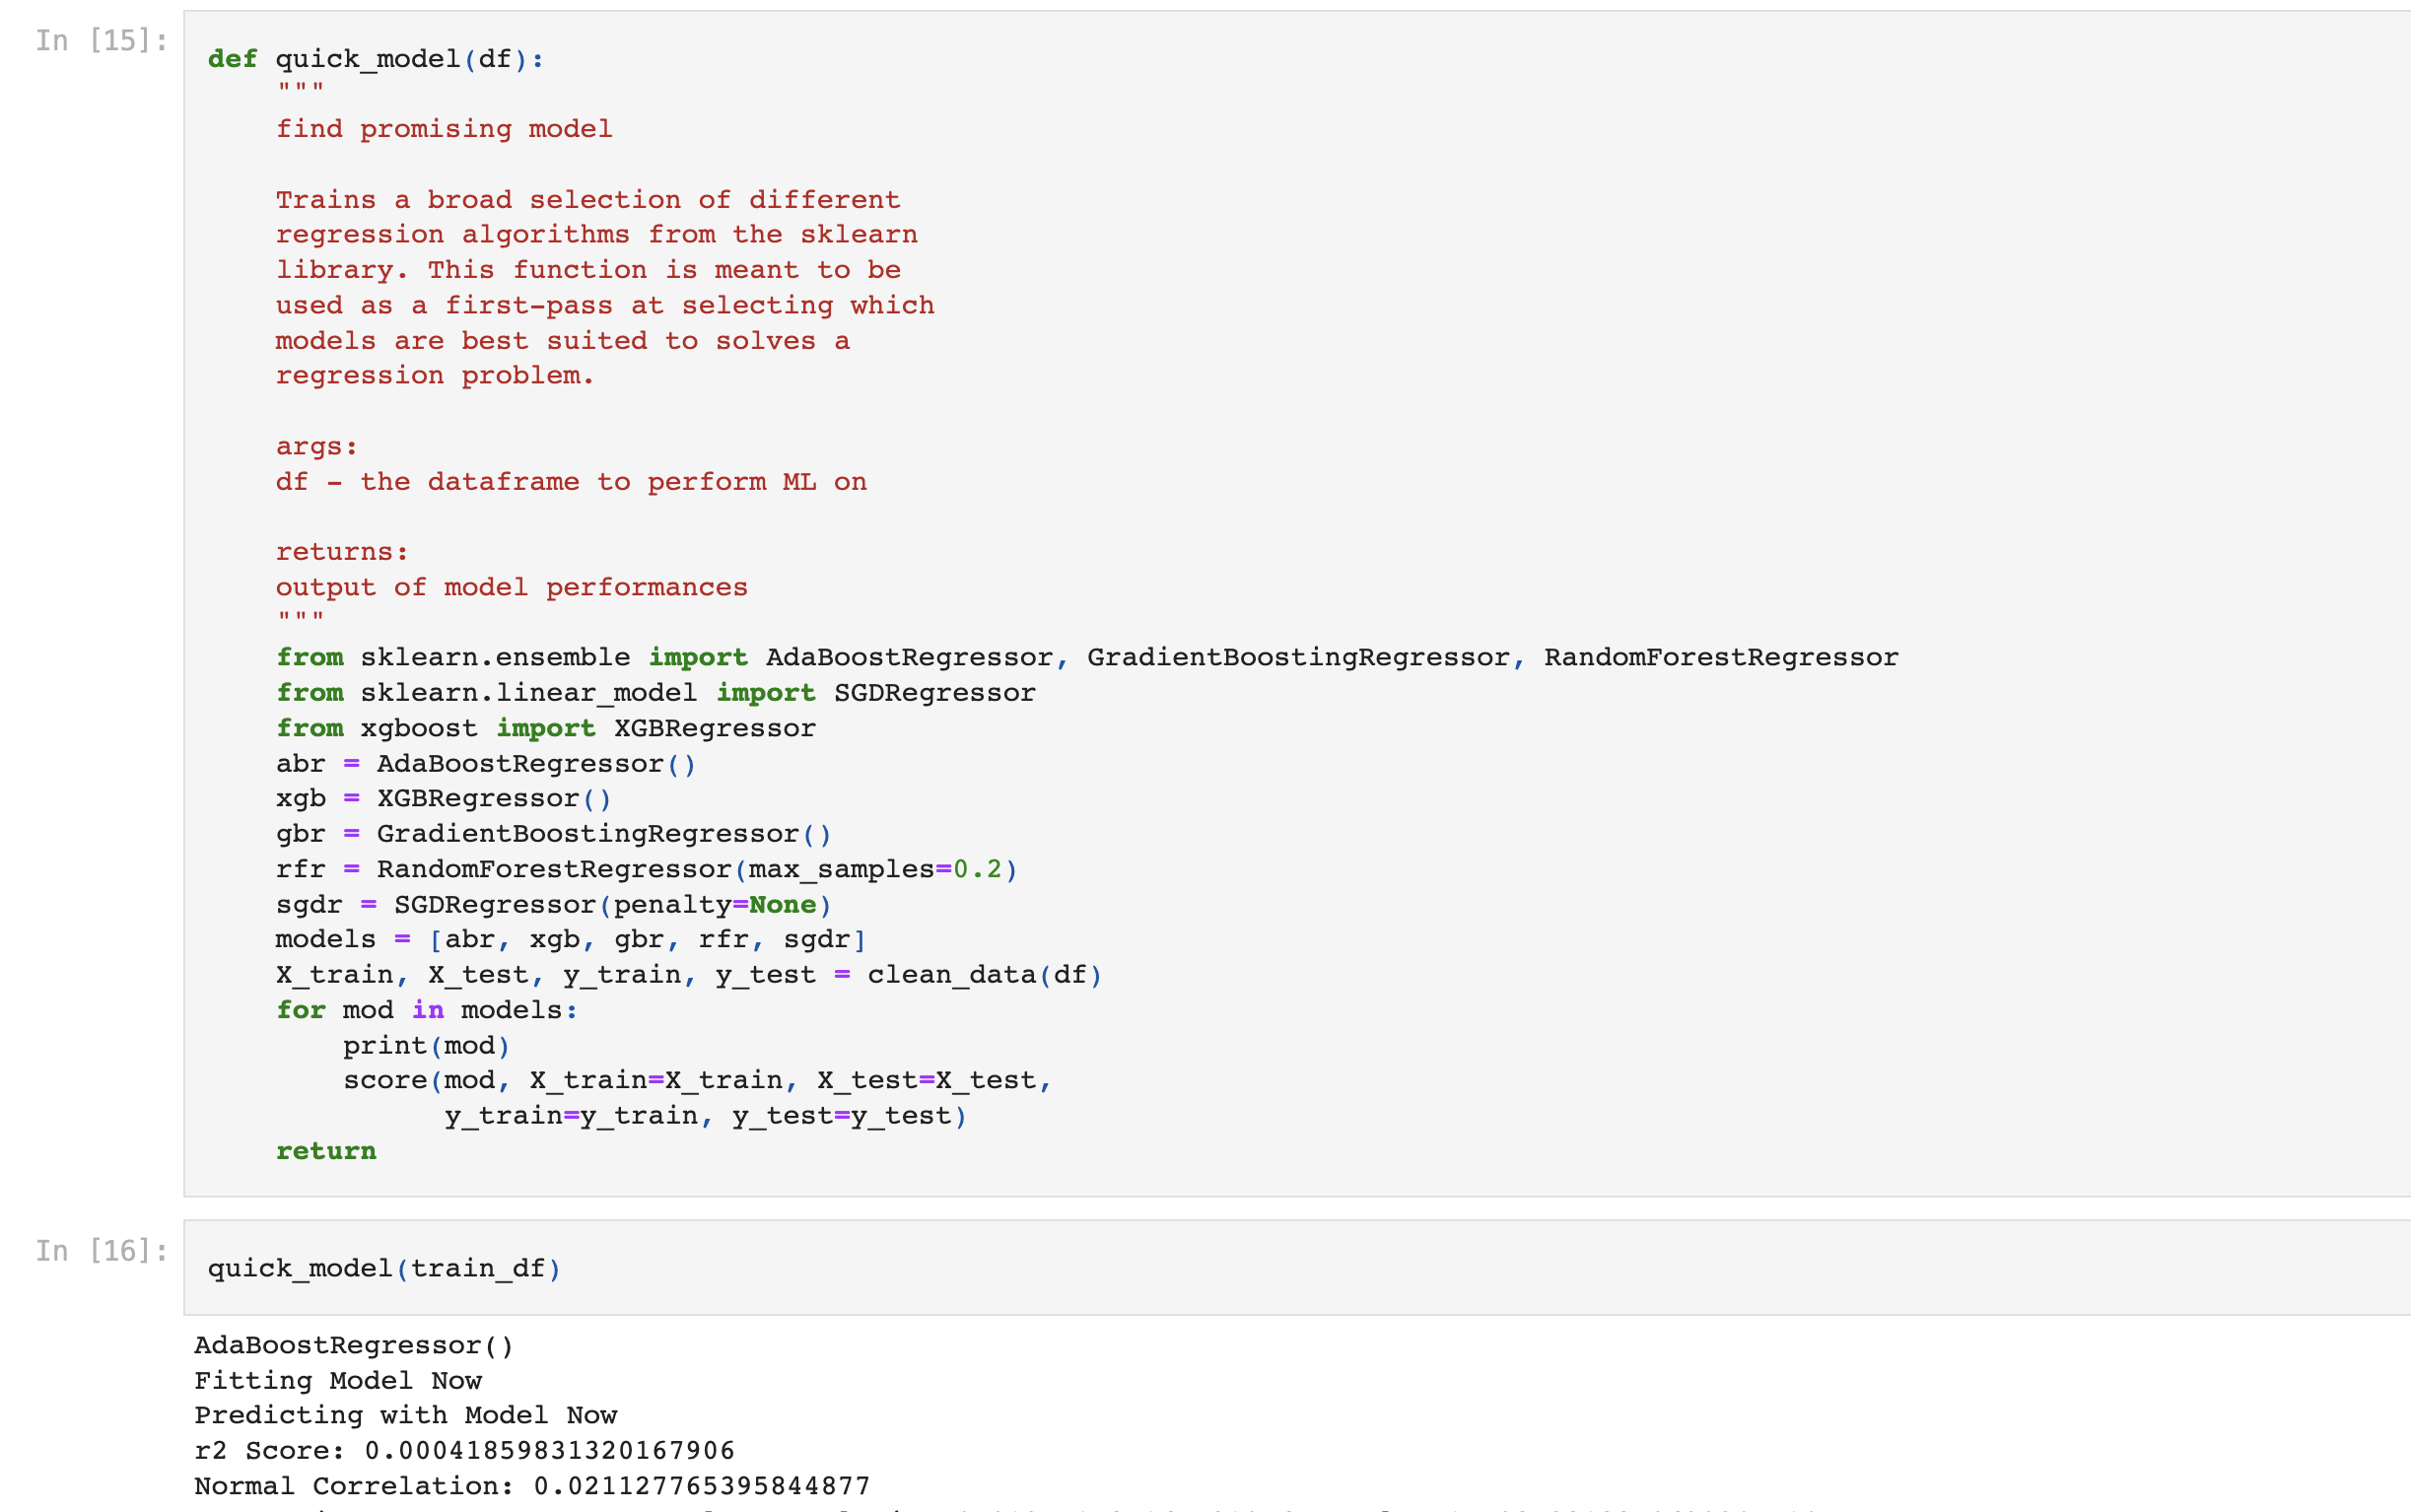
After observing initial results, I used a similar function to examing some more results from some more advanced algorithms. This process produced some of the best model choices available to me, and I was able to take some more precise decisions in what my final model would look like.
Model Evaluation and Validation
So with the final choices in hand, for a final pass at model choice, I created a cross validation pipeline to choose the best hyperparameters for my model. This ensured that without any additional feature engineering, I am using a model which is dependable in it’s ability to make predictions. This final model from the cross validation process is the model that will stay with my project for a long time.
Results
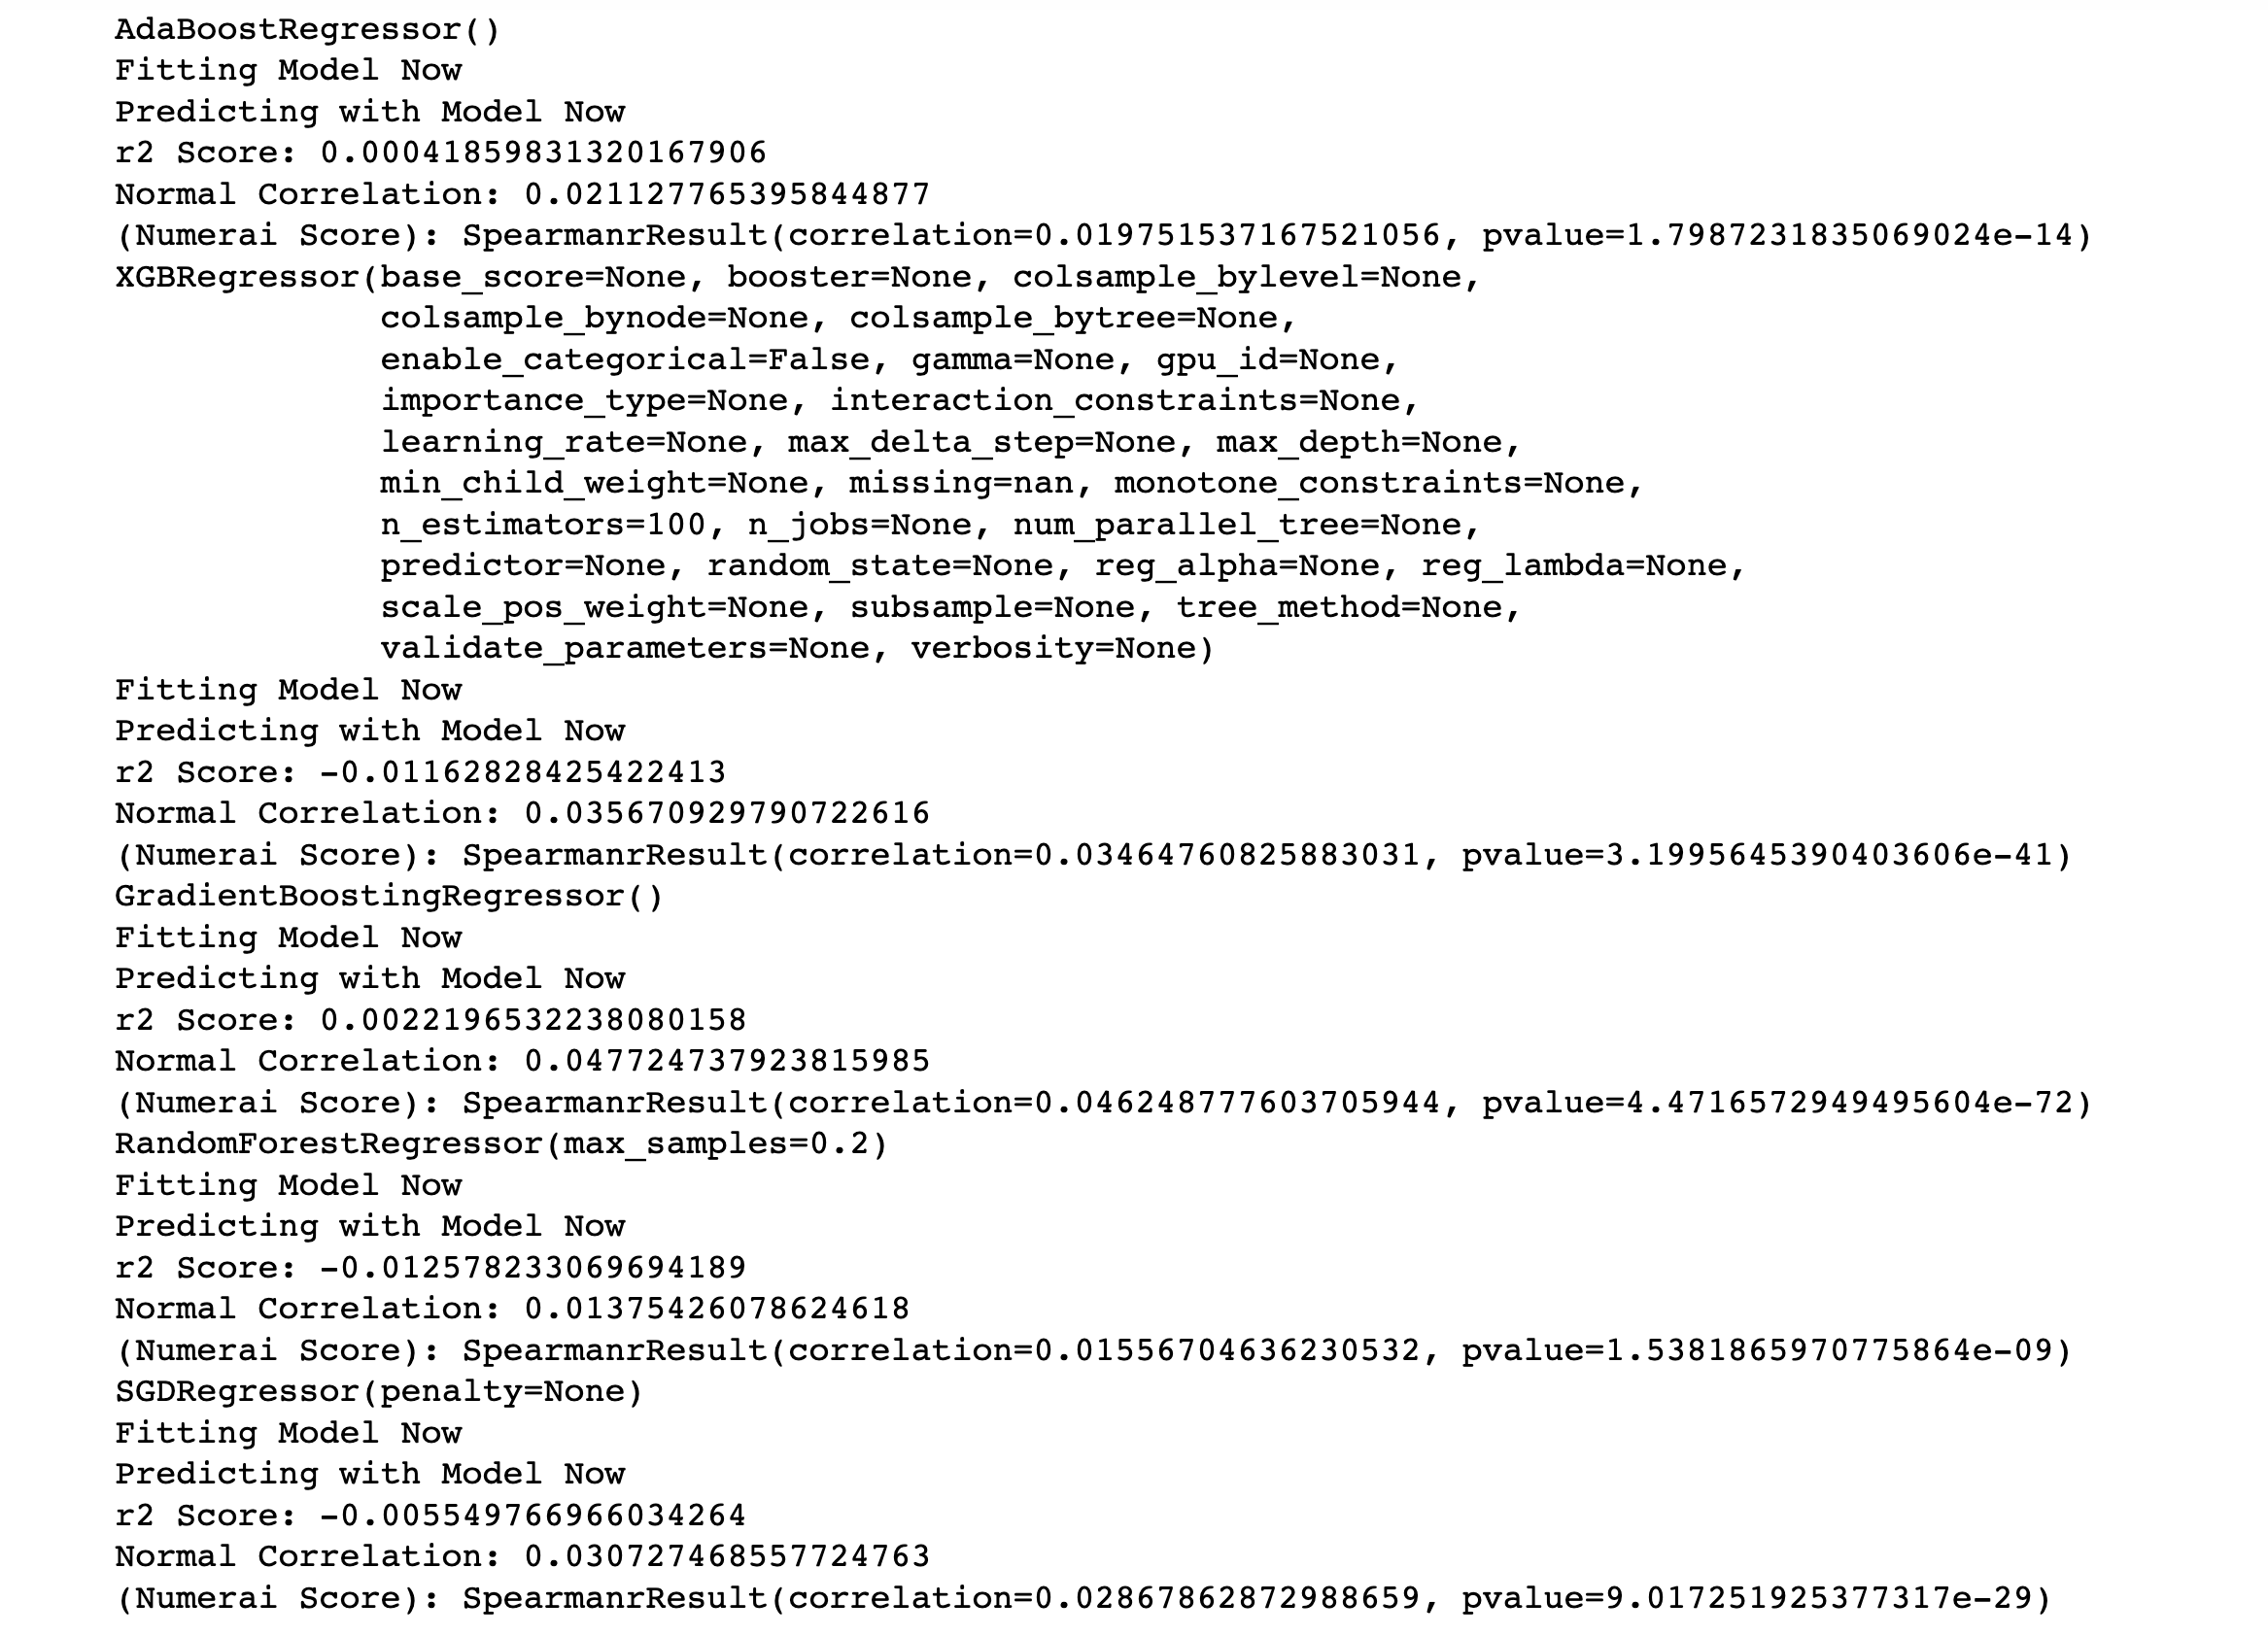
So after our initial model implementation, we did a refinement of the same process to further evaluate which would be our model of choice. After refinement, some key results that helped us shape our decisions can be noted. Firstly, the newly implemented adaboost did not perform impressively in either r2 Score or correlation, but it did provide a larger p-value than the rest of the models. Because a larger p-value indicates more confidence in predictions, this means that we should retain the idea of using some sort of gradient boosting for our final choice. Using a different architecture such as XGB may provide the same or similar improvements while also dramaitcally increasing efficiency. The XGBRegressor produced a strong r2 score , although it was negative. This is something that could be corrected through enhanced parameters. The p-value associated with this regressor was also notable when compared to the performance of a regular gradient boosting regressor. Our third model was a sklearn gradient boosting regressor and it had a lower r2 score, although it had a slightly higher correlation,the p-value was essentially half as small as that of the xgbregressor. Also, our Random forest regressor with added sampling again performed notably well. The r2 score had the strongest signal of all models (again, it performed worse than random, but we may be able to correct this.) Overall, when considering the scoring of the random forest model, although it shows to score well, it is a very computationally expensive model to train, so using it for gradient boosting as well as cross validation would not be very efficient at all.
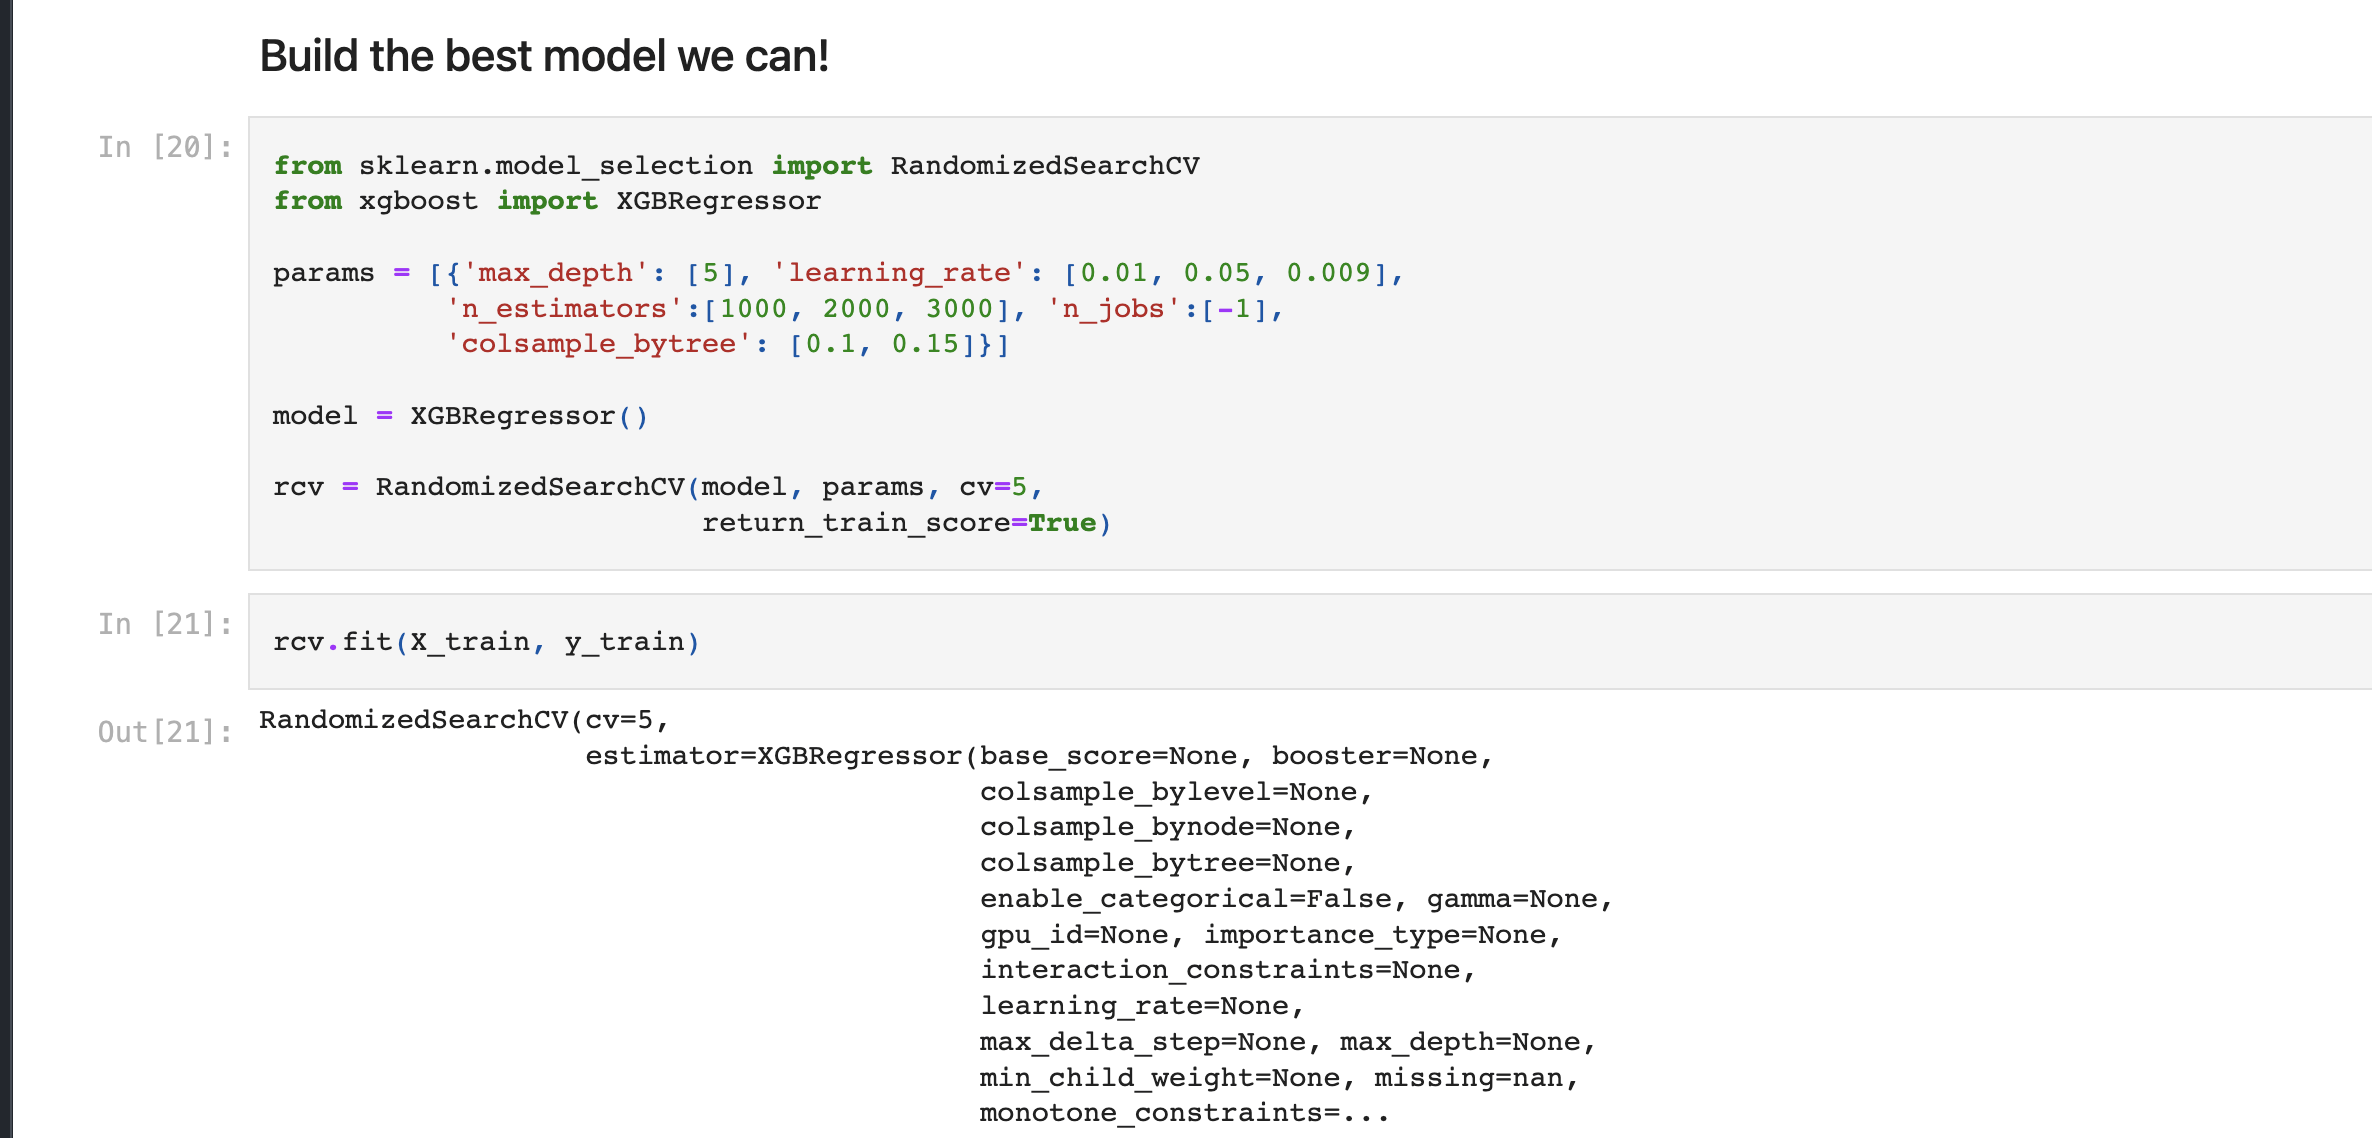
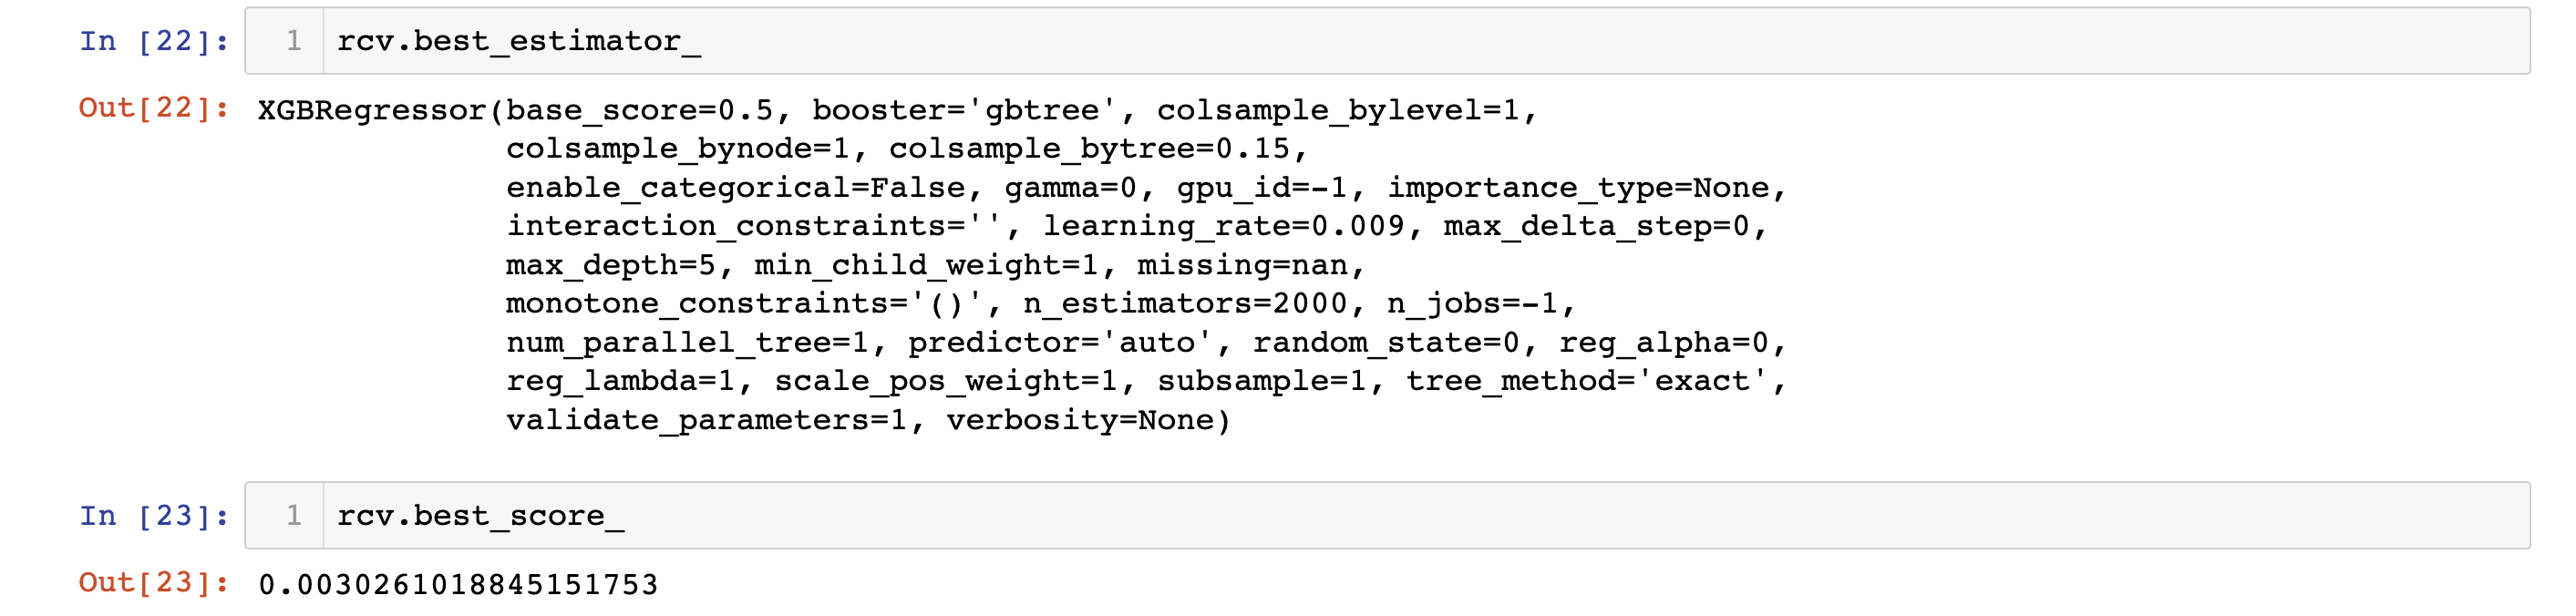
With the above notes in record, we can create a final situation where we can do cross-validation for our model of choice. It is a good idea to functionalize the process of cross validation for more than just one model at a time, but it takes much more resources in terms of time and complexity. For the purposes of our work, I will create a randomized-search cross validation from sklearn, and I will use an XGBR estimator. Gradient boosting across all different algorithms showed improved scoring, and XGB is a version of the algorithm which is much more efficient than other gradient boosting algorithms, so it is a great choice for a CV experiment.
For our CV, we optimized three different hyperparameters. Our learning_rate, which controls how quickly or slowly our gradient is updated, was given three values to choose from, and ended up being optimized at a value of .009. This serves as an indication that, with further experimentation we should further provide smaller learning rates to choose from, to see if we continue to improve results. We also provided some choices for colsample_bytree which does two things. The first most important one is by limiting our exposure to the number of samples we can expose each estimator to, we greatly reduce overfitting by not seeing the same observation too many times. This method also works to increase efficiency by reducing the amount of memory needed to complete model training. A third hyperparameter we also experimented for was n_estimators. This hyperparameter controls the number of gradient boosted trees used to train the estimator. Based on the parameters chosen for the best model, we can observe that more is not always better, in the sense that we offered to experiment with a model of 3000 estimators, but the optimized model was found to perform best with 2000.
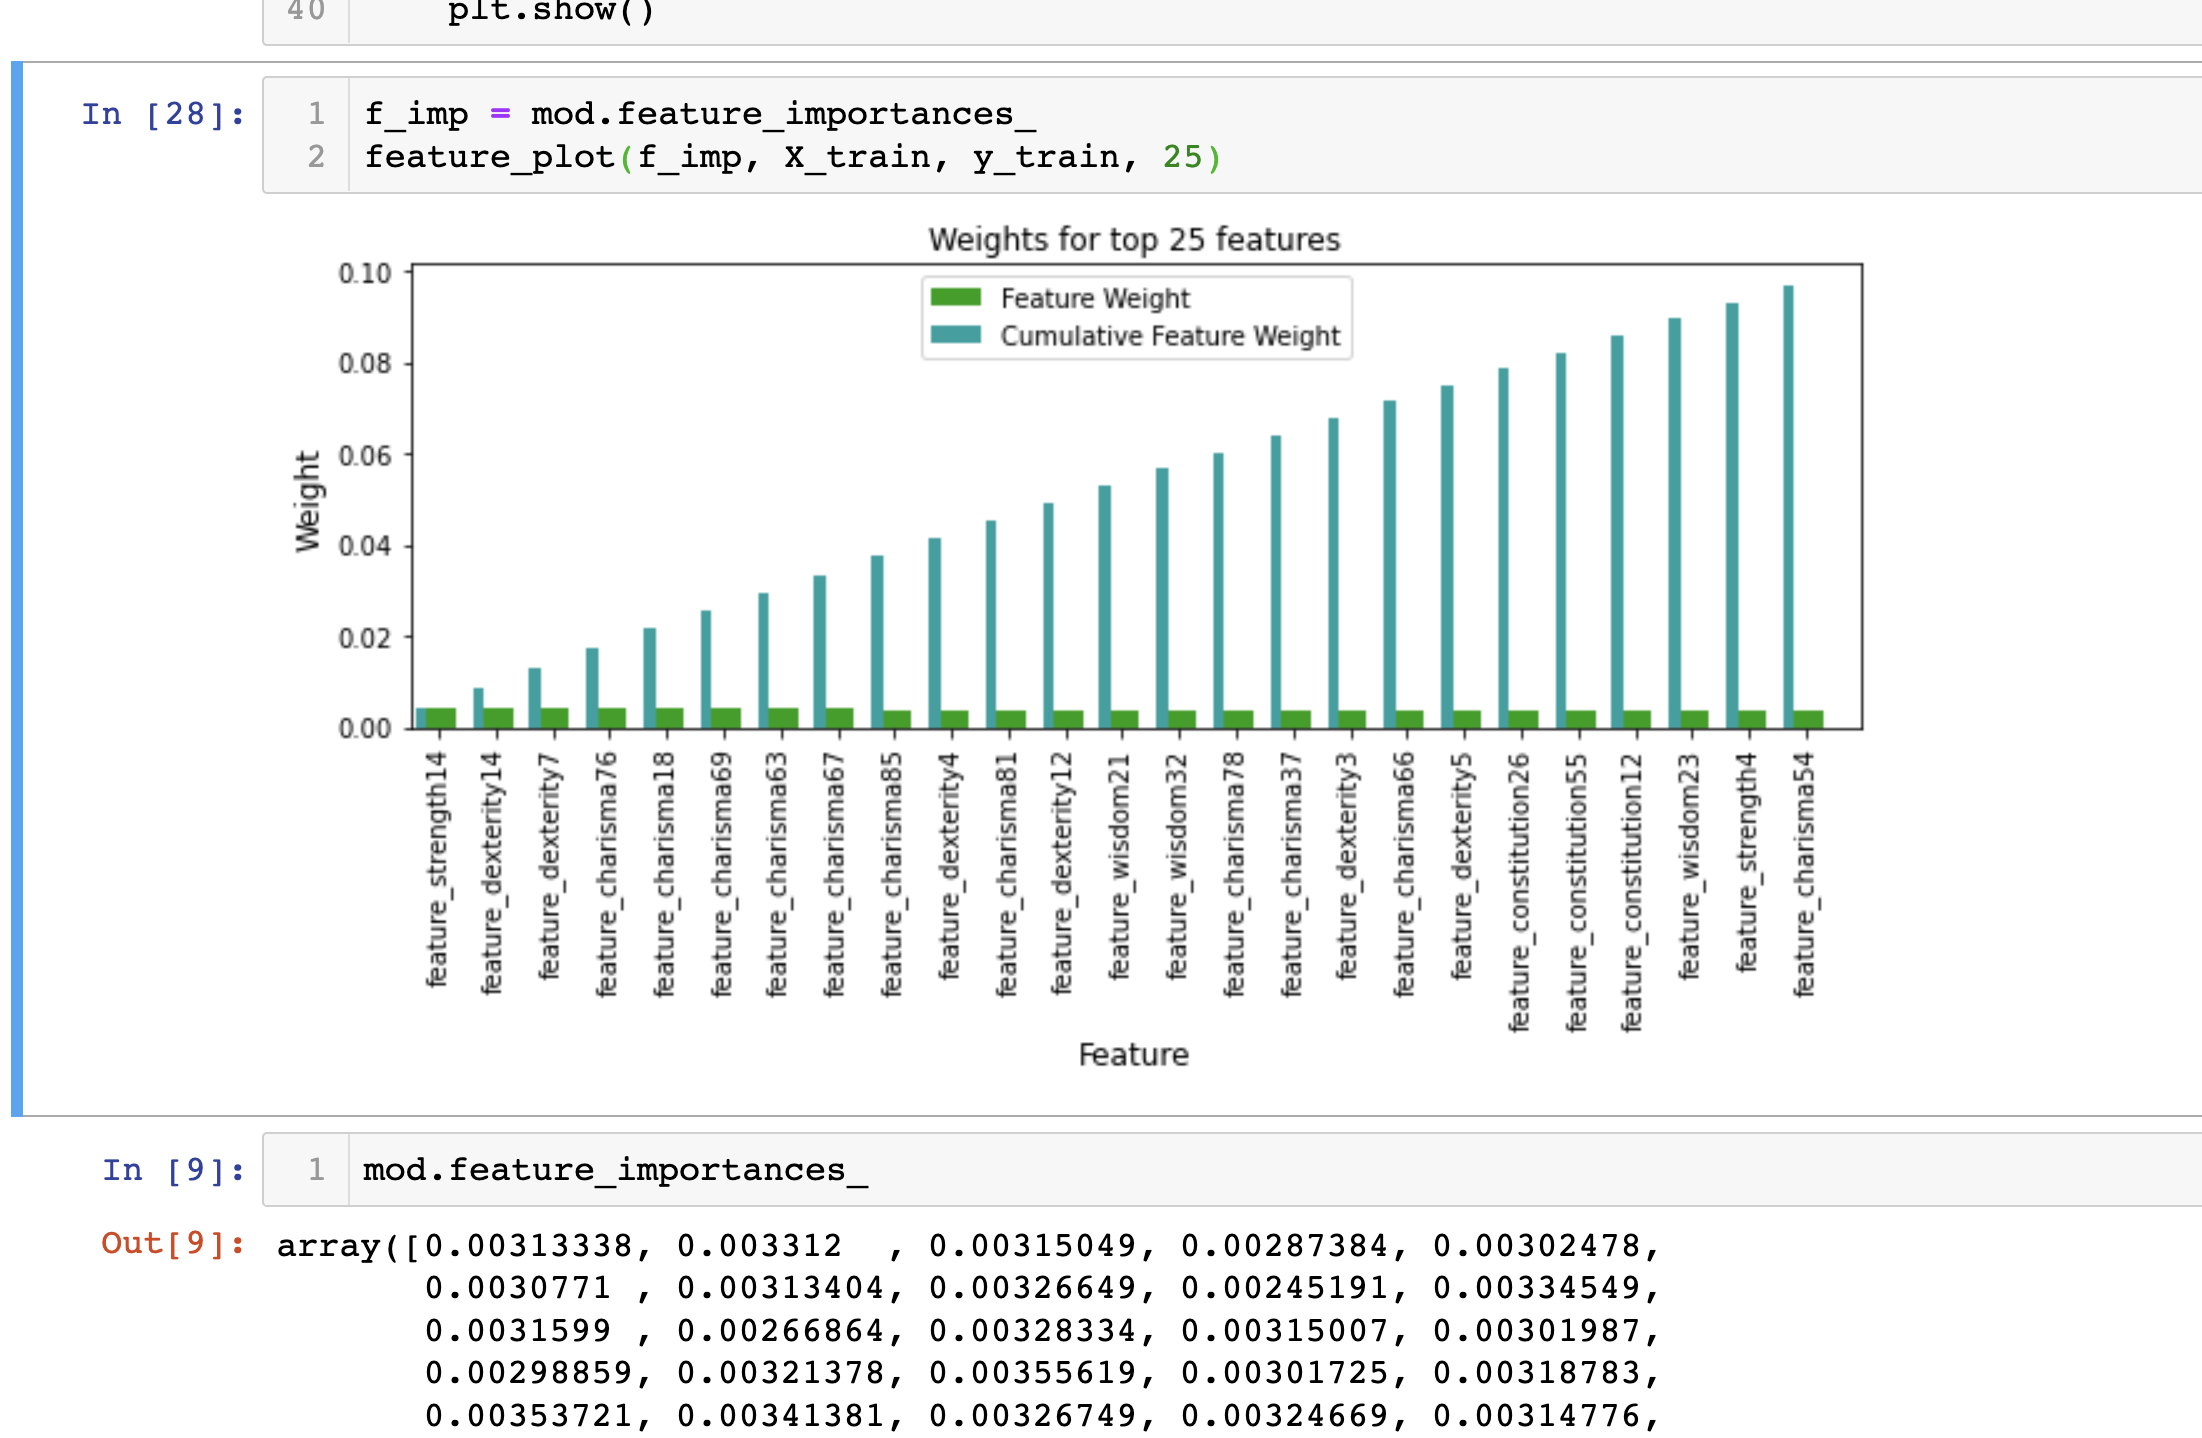
We can observe that the features had a uniform distribution of weight across the top 25 features with very little variation. This trend can be confirmed when examining the array of raw values provided from the feature importance attribute of our model. We would typically expect some features to have more importance than others, but this case shows that all of the features have the same weight. This actually makes sense, because as described earlier, all of the features have been pre-engineered for us! When re-considering what this means, it is much more of an intuitive result to observe that all of the features have the same weight. For future improvement we could absolutely work to further engineer these features, and that could potentially be somthing useful.
Justification
After testing the final model, we find that we almost double our correlation metric from our original OLS regression model. We ended up with a gradient boosting regressor, and so we can see the improvements in our product as a result of using a model which accelerates learning on gradients which show steeper curves and also the fact that we are using decision trees which provide predictions of values instead of a single regression line, as is found in regression.
Conclusion
Reflection
Upon completing this workflow , I see a lot of potential for improvement. I am overall very happy that I am able to contribute the novel workflow of automating this process with IBM Cloud at no cost to users. I believe that my solution to automation is actually a more streamlined process of what is available with AWS and the CLI, thanks to the power of notebook jobs from IBM’s CP4D platform. Hopefully this workflow inspires more practitioners to deploy their own solutions and to continue to build upon the results of those deployments.
Improvement
Besides defining my evaluation metrics, I have really not spent much time researching the available knowledge from numerai’s community. Some next steps include spending more time with the numer.ai community to share insights as well as to learn a lot more from what they have to offer. There has been a plethora of material and ideation taking place within their forums and I highly recommend anyone interested to explore their archives. For immediate next steps for my project, improvement is definitely possible with some advanced feature engineering. Engineering features to consider some features more heavily than others, or considering some eras more heavily than others will surely prove to show some different outcomes. Thankfully this competition provides me with the perfect place to practice and enhance my skills.
This blog post barely scratches the surface for everything that has to do with the numer.ai competition. As far as the data goes, we can go into deep-dive discussions about the structure of the data, the relationships that we can uncover, and how we can get into some more advanced feature engineering with what we have to work with. With modeling, we could explore a wide variety of machine learning models that can be fit to predict this data, and why some models are better than others. Again, I highly recommend researching through the forums of numer.ai to learn and contribute your ideas. As far as automation goes, go to my github repository and follow the instructions in the readme. Feel free to contact me to chat!